WillowSpace makes it easy to keep track of your growth, performance, and client trends with a simple, visual Reports section. Whether you're looking to understand where leads are coming from, which clients bring in the most revenue, or how your services are performing—this area gives you valuable insight at a glance.
Where to Find Reports
To view your reports:
-
Log into your WillowSpace account
-
Click Reports in the left-hand menu
-
Choose the report you’d like to explore from the list
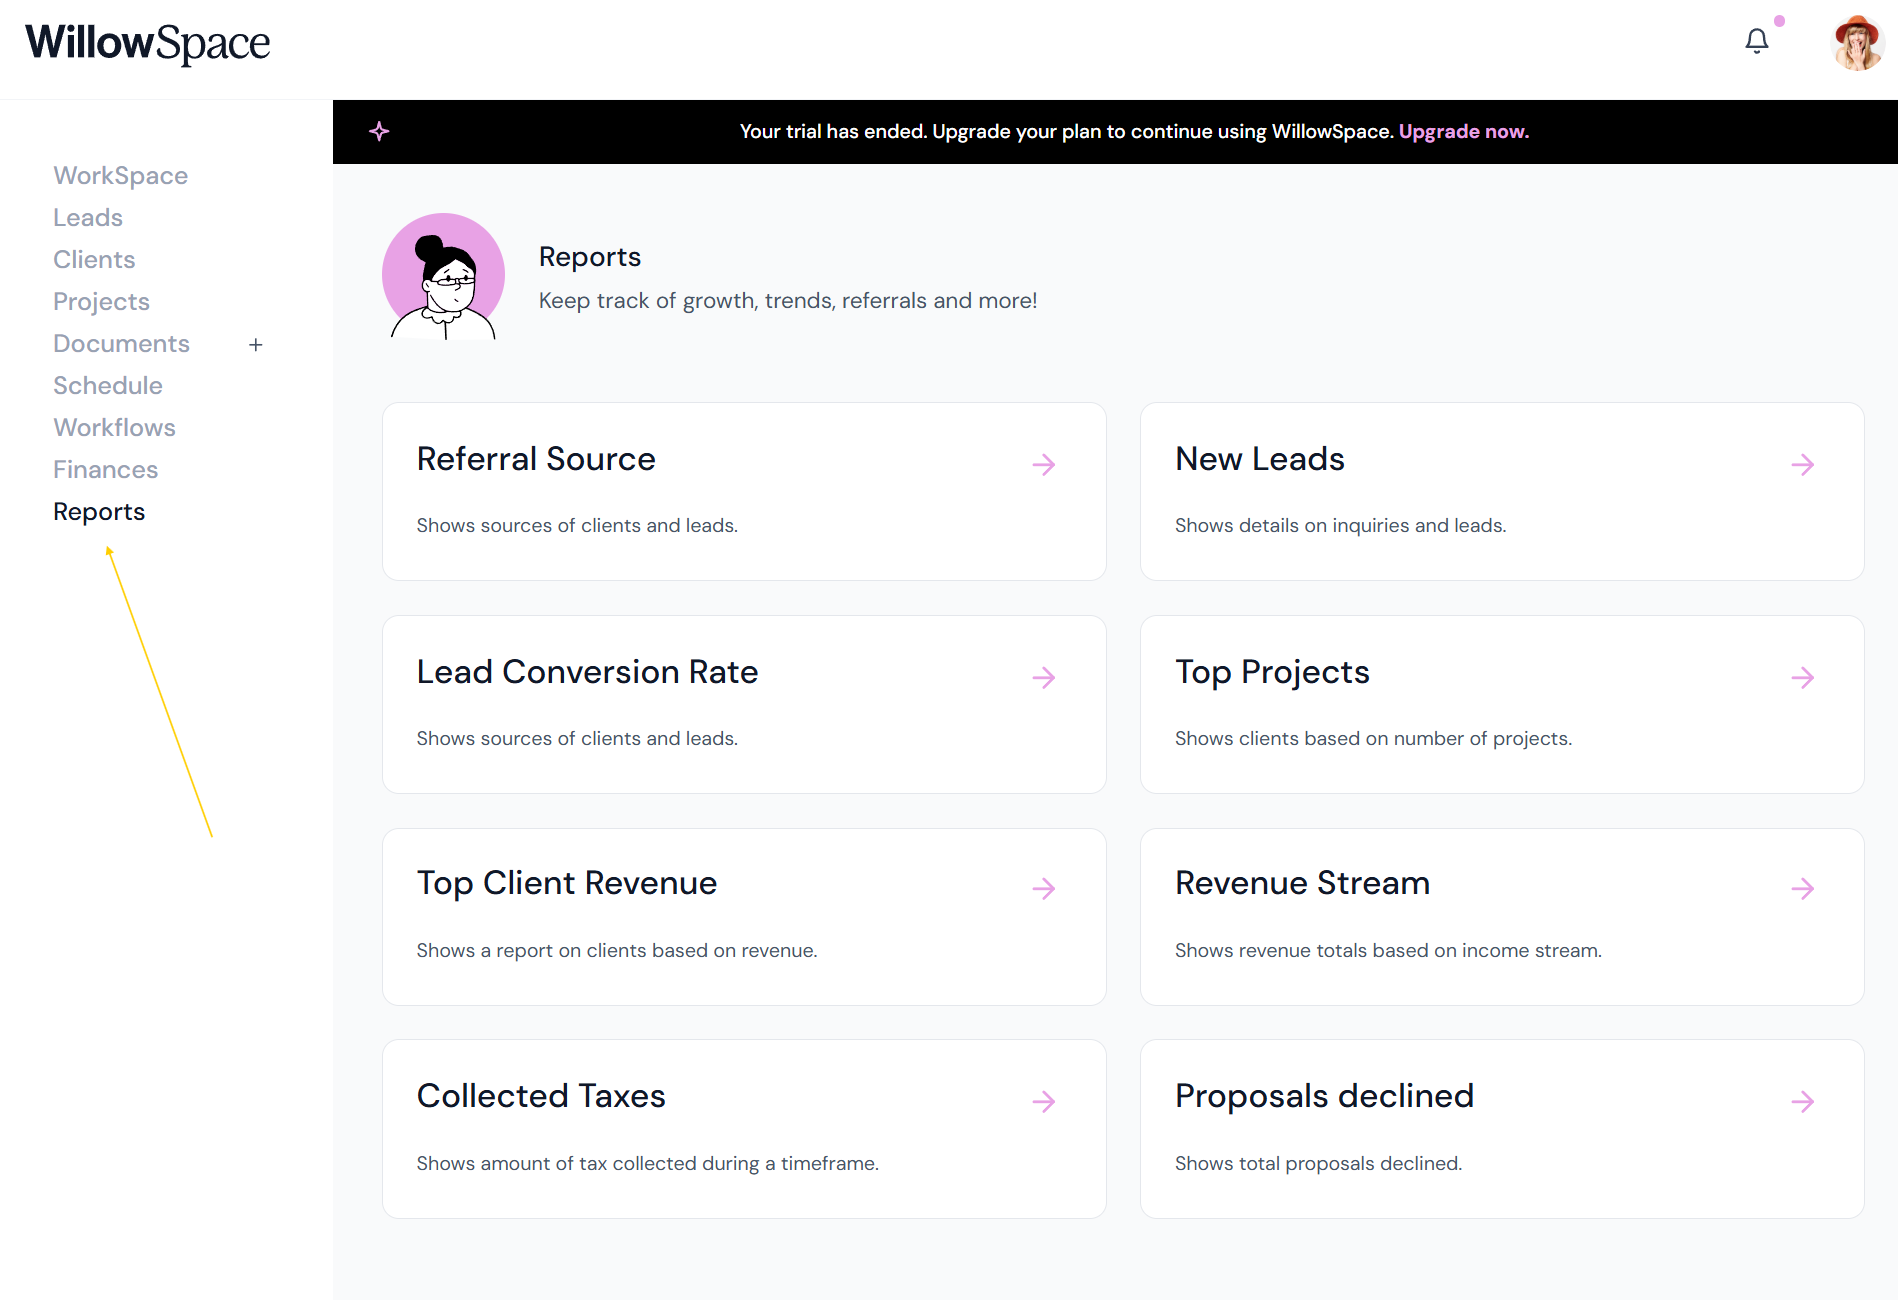
Each report is generated automatically based on your existing activity (leads, proposals, invoices, etc.), so there's no extra setup needed.
Types of Reports Available
Here’s a breakdown of what each report shows and how to use it:
🆕 New Leads
Shows the total number of leads added over time. Use this to track inquiry volume and seasonal trends.
🔁 Lead Conversion Rate
Displays the percentage of leads that convert into paying clients. Great for evaluating the effectiveness of your outreach, proposals, or onboarding process.
📣 Referral Source
Shows where your leads and clients are coming from (e.g., word of mouth, Instagram, search, etc.). Track which marketing channels are performing best and where to focus your efforts. You can edit these anytime in Settings > Finances.
💼 Top Projects
Ranks clients by the number of projects you’ve completed with them. Use this to see which clients are giving you repeat business.
💰 Top Client Revenue
Ranks your clients by the total revenue they’ve brought in (based on paid invoices). Helpful for understanding who your highest-value relationships are.
💸 Revenue Stream
Breaks down your income based on custom revenue categories (if you assign them in invoices). Useful for understanding what services are generating the most income.
🧾 Collected Taxes
Shows the total amount of tax collected through your invoices—helpful for accounting and tax reporting.
❌ Proposals Declined
Shows how many proposals were declined over time. This can help you identify patterns in pricing, timing, or project fit and refine your sales process.
Customizing and Filtering (If Available)
Some reports include dropdowns or filters to adjust the date range or type of insight shown. Use these to narrow your view or spot trends over time.